The Science Behind Beer Bellies
Go to any crowded place and notice how many normal guys from slim to average builds have protruding abdomens, like this:


What used to be a telltale sign of middle age in the developed world has become an epidemic to men in their 30s, 20s, and even teens. This writing is designed for you to learn all about this phenomenon. I’ll explain what beer bellies are scientifically, their health effects, and most importantly, the thing everyone else gets wrong: why they develop.
Part 1: What Is a Beer Belly?
Different Types of Fat
Culturally, we usually think of fat storage as a bad thing, and fat burning as a good thing. In reality, body fat, or adipose tissue, is important because our cells use it for energy when immediate energy from food isn’t available. Adipose tissue manifests itself in different ways: by cell type and by location. First, cell types: different fat cell types include white, brown, and beige. White adipose tissue comprises the majority and serves as the energy storage depot we typically think of. The other colors are interesting in their own ways, but not relevant for what we’re looking at. Second, location: fat can be classified by location as subcutaneous adipose tissue (SAT) or visceral adipose tissue (VAT).
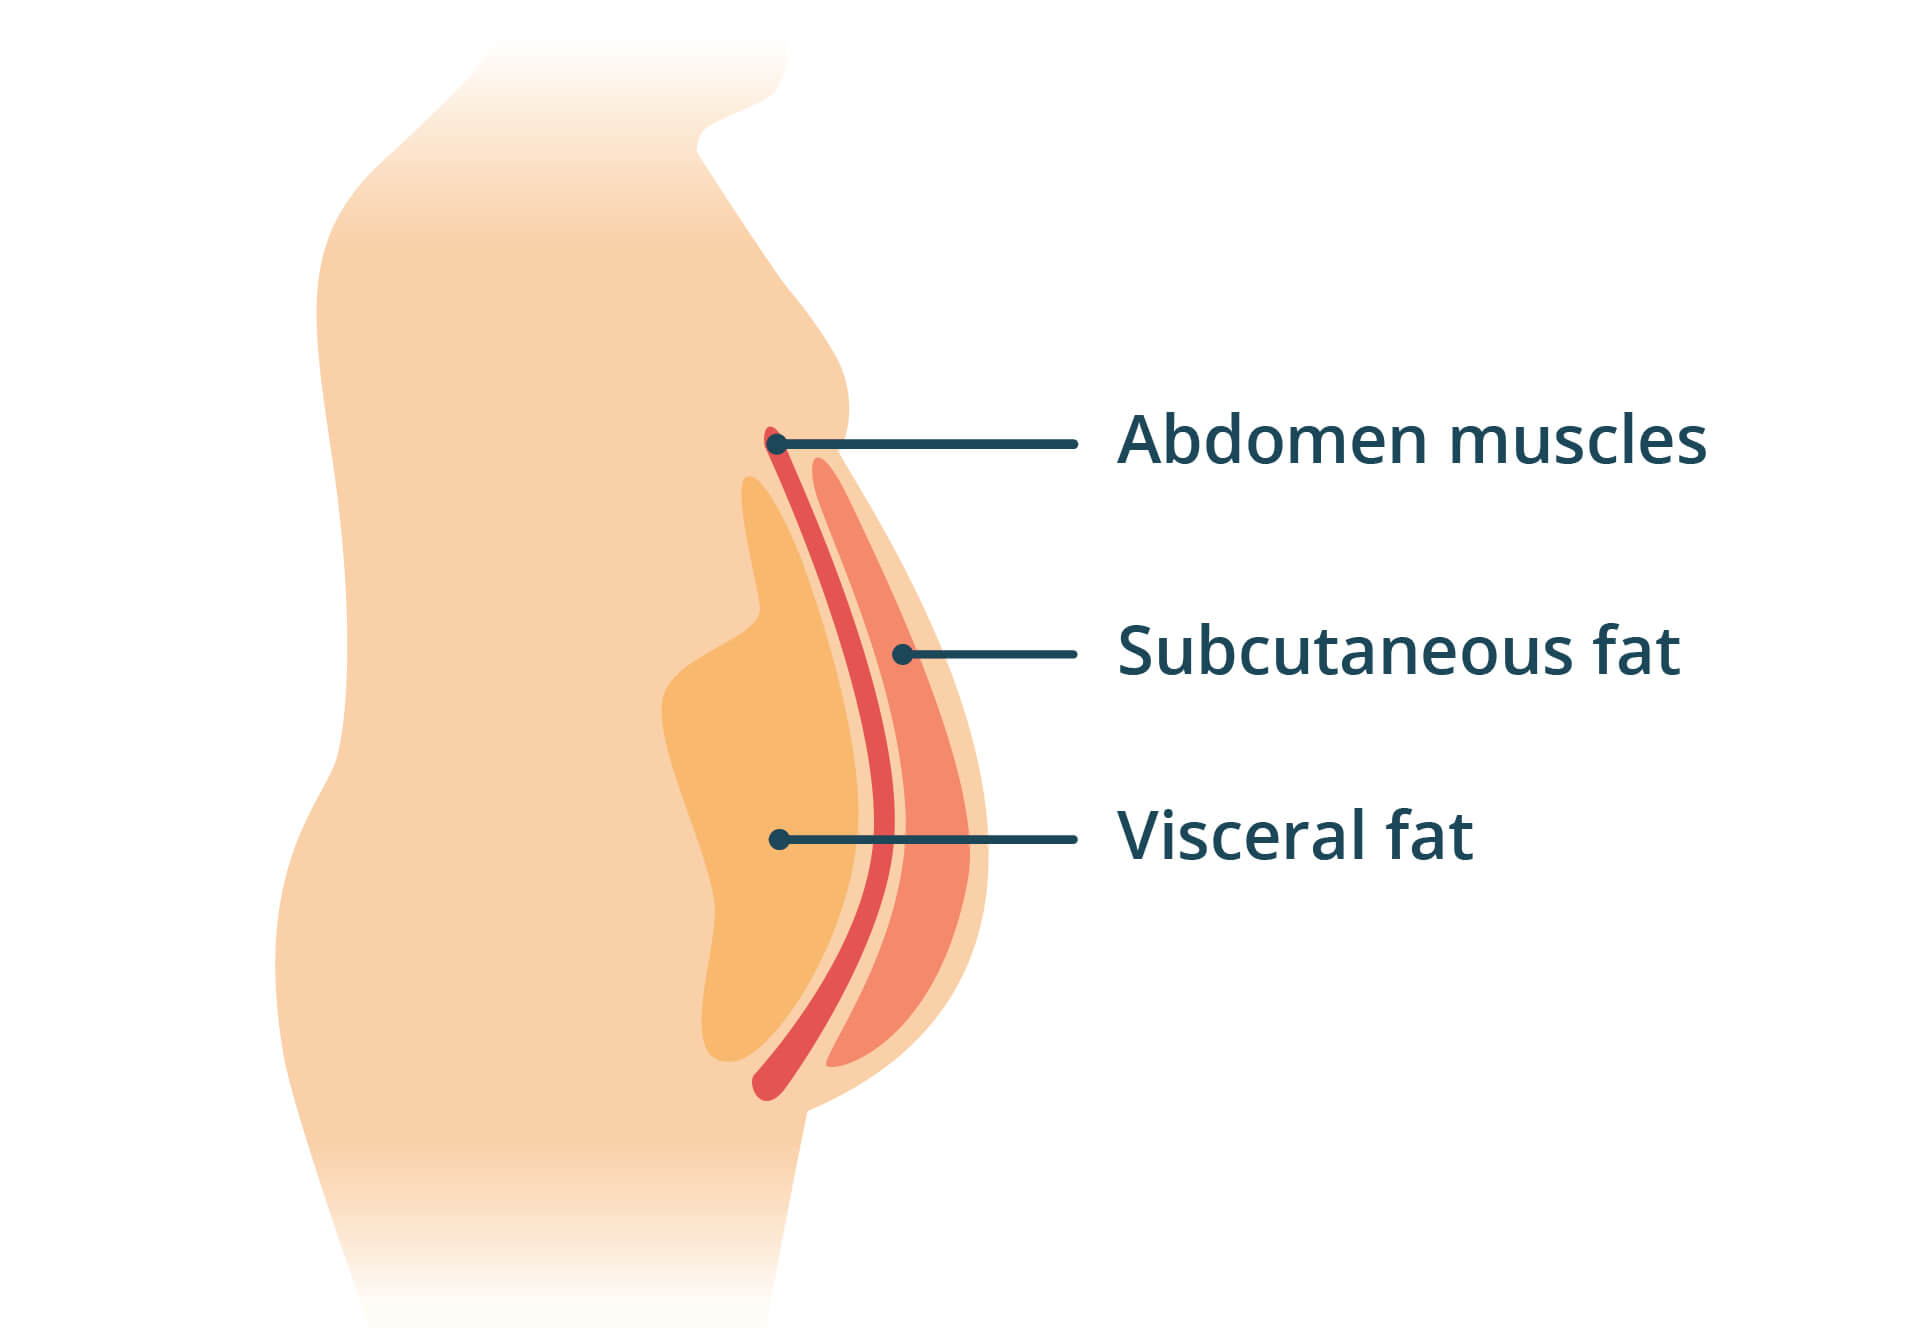
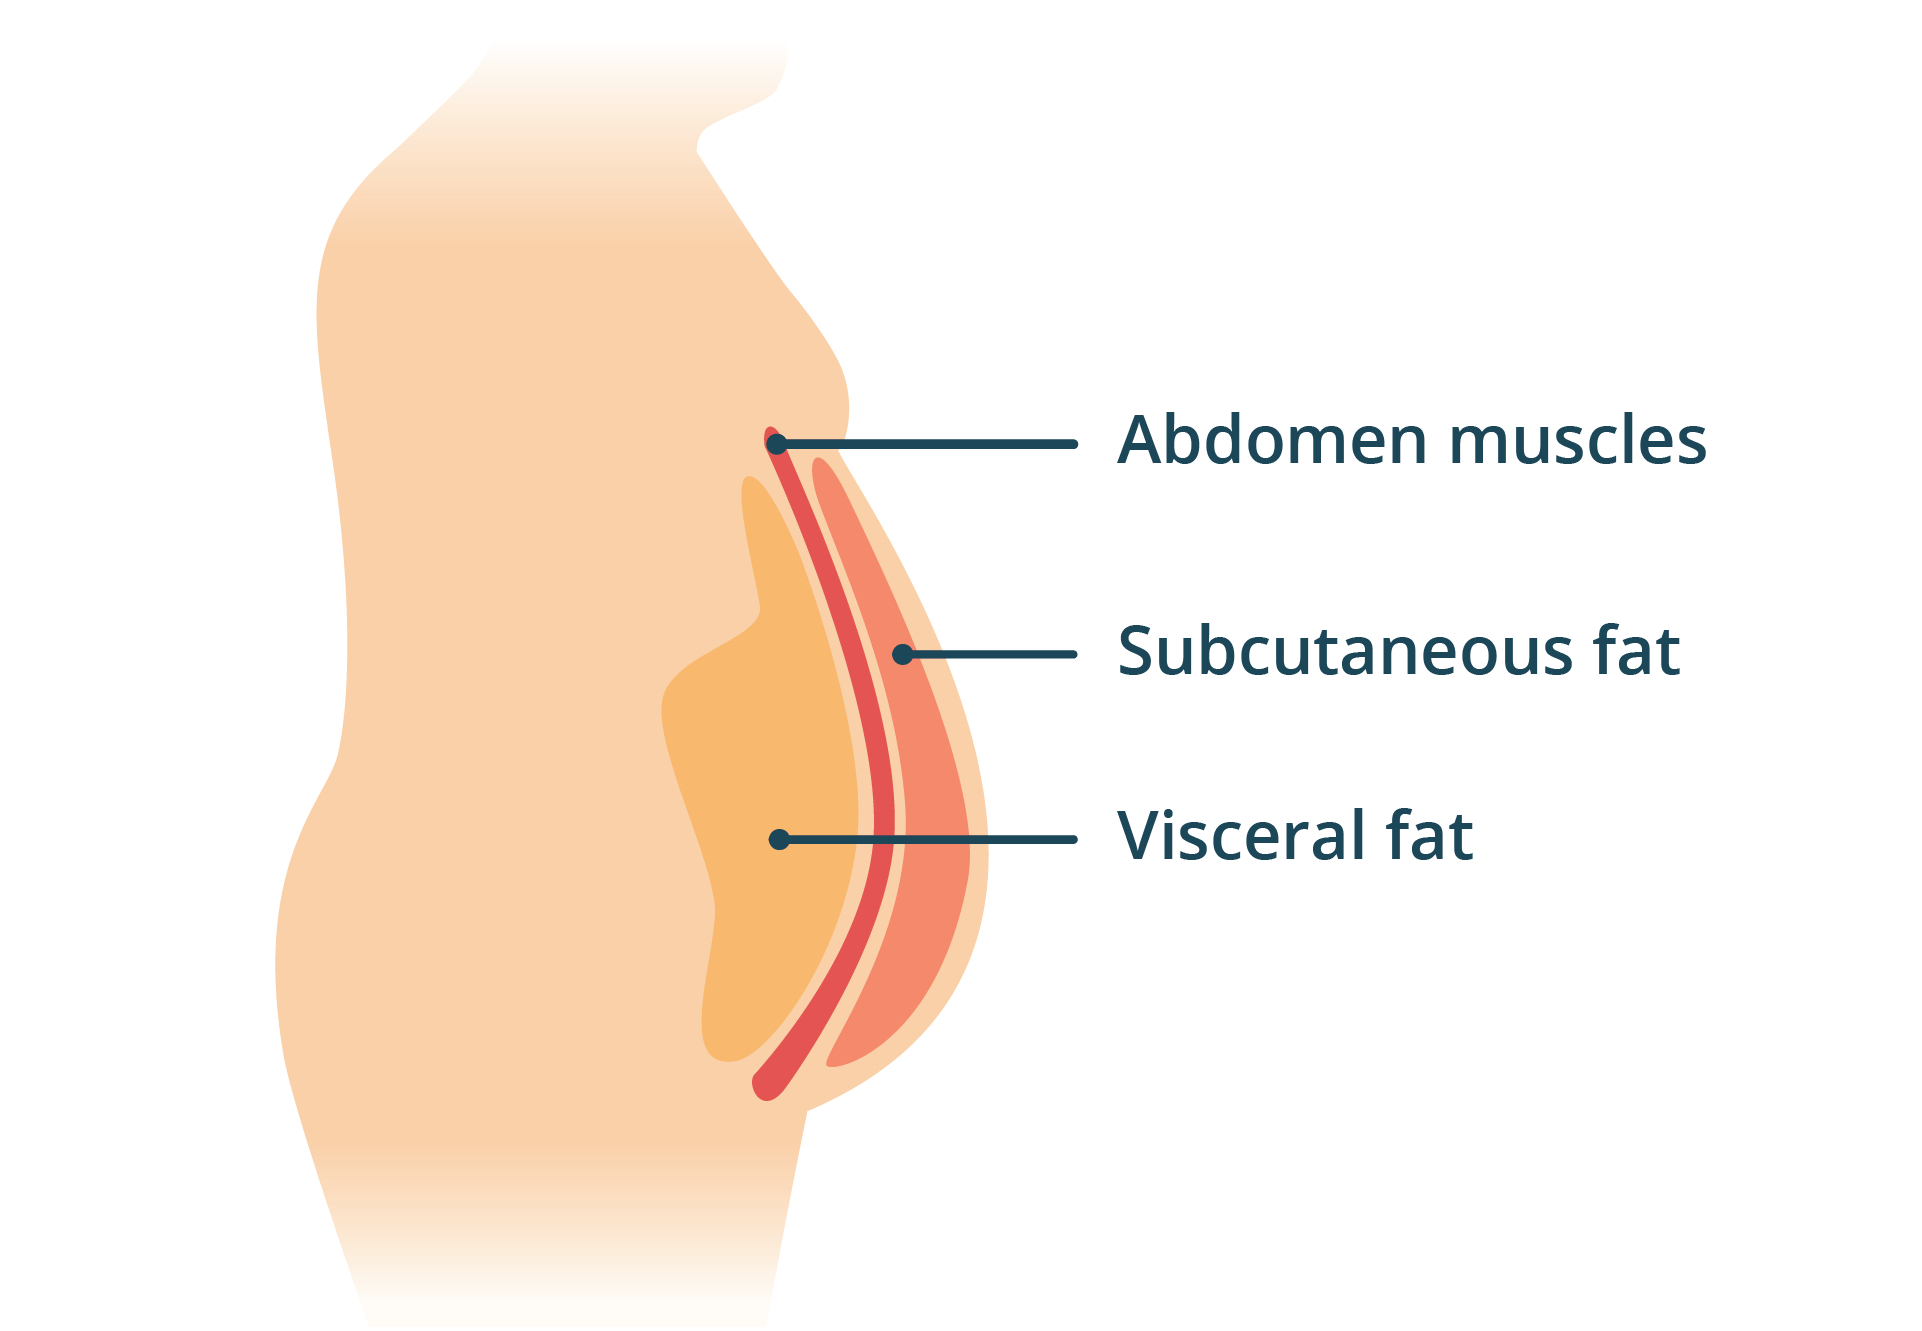
SAT acts as a benign energy reserve and endocrine signaler. It’s surface level and distributed fairly evenly around the body, with the exact distribution varying a bit between people. VAT, on the other hand, is fat stored directly around internal organs and is related to a number of negative health effects. That’s the fat mostly responsible for the classic abdominal protrusion pattern.
Subcutaneous adipose tissue (SAT) is benign fat at the surface. Visceral adipose tissue (VAT) is fat around internal organs, contributing to abdominal protrusion and correlating with negative health effects.
Part 2: The Conventional Understanding
Genetic Differences in VAT Accumulation
A quick internet search will yield lots of results saying that having significant visceral fat is not a good thing. To evaluate this claim, we want to look at some ideas of how and why it develops.
It turns out different populations tend to accumulate different amounts of VAT at similar body mass index levels. This 2007 paper points out that South Asians tend to develop central obesity (from VAT) more easily than Caucasians, for example. The authors propose a hypothesis based on this pattern: VAT develops when SAT expansion capacity is exhausted, and the reason South Asians accumulate VAT easily is because their SAT expansion is genetically low. Therefore, according to this reasoning, South Asians generally develop metabolic complications at lower total fat mass than Caucasians do because those complications arise when SAT expansion is exhausted.
One hypothesis: Genetic SAT storage capacity is exhausted, then fat gets stored in VAT and organs.
This 2014 paper builds on this idea by describing a “personal fat threshold” for which when exceeded, type 2 diabetes develops, even when obesity is not present. A 2017 paper by Lotta, et al. also identifies genetic variants in SAT storage capacity, and that this capacity is related to insulin resistance. So it seems true that populations and individuals with certain genetic variants do generally show earlier metabolic disease at lower BMI. Applied to lifestyle, the research implies a temporal sequence: first, lose weight, and disease will improve while organ fat and VAT start vanishing. Then lose more weight and SAT will be reduced. But there’s a huge problem with this idea that experimental evidence completely overturns.
Part 3: Breaking the Conventional Knowledge
Health Effects of VAT
An important question to ask about VAT: does it cause problems on its own, or is it simply a marker that is correlated with other problematic outcomes? This paper by Fabbrini, et al. argues that a causal relationship between VAT and metabolic disease has never been demonstrated, and follows with an interesting experiment. The experiment introduces another independent variable, intrahepatic triglyceride (IHTG) content, which is fat that accumulates inside liver cells. Two groups of 20 obese subjects were studied as follows:
Group 1: 20 obese subjects with similar VAT and varying IHTG. Group 2: 20 obese subjects with varying VAT and similar IHTG.
Variance of specific metabolic markers shown below were measured in each group. If VAT was causing metabolic disease, we would expect group 2 to show high variance of measurements. If IHTG was causing metabolic disease, we would expect group 1 to show high variance of measurements. Finally, if both VAT and IHTG were causal, we would expect both groups to show variance of measurements within their respective group. The measurements:
Group 1, high-IHTG:
- Hepatic insulin sensitivity 41% lower
- Skeletal muscle insulin sensitivity 36% lower
- Adipose tissue insulin sensitivity 13% lower
- VLDL-TG secretion rate nearly doubled
- Plasma insulin nearly doubled
- Adiponectin 50% lower
Group 2, high-VAT:
- No difference in hepatic insulin sensitivity
- No difference in muscle insulin sensitivity
- No difference in adipose insulin sensitivity
- No difference in VLDL-TG secretion rate
- No difference in any plasma metabolic variable
That’s strange. VAT is commonly thought to be problematic, yet here, it doesn’t appear to cause any direct harm. It’s also a good demonstration how a quick internet search can be wildly misleading from what actual research shows. On the other hand, practically speaking, excess VAT should be a red flag. While it’s not causal on its own, it still often correlates strongly with IHTG levels, despite the subjects of the above study chosen as exceptions to that correlation. For example, this paper illustrates population findings that VAT is correlated with liver fat content, but SAT is not. Population studies are far from conclusive, but the mechanisms explaining the correlation between VAT and IHTG will become much clearer shortly.
Additionally, Fabbrini’s data contradict the SAT capacity overflow theory. If the overflow theory is correct, then after SAT capacity exhaustion, we would expect VAT and organ fat continuing to increase. But Fabbrini’s data show that even with severe liver fat accumulation, IHTG is only about 1% of total adipose triglyceride mass. That’s tiny! If SAT were truly full and all excess went elsewhere, VAT and ectopic fat (the fat directly inside cells of organs) would keep climbing without limit as someone keeps overeating. Instead it stays a small, bounded fraction, which is not what a “hard stop then overflow” model predicts. So if overflow is not the answer, what is?
Based on the data, a hard stop on SAT accumulation doesn’t make sense.
Part 4: The Signaling Problem
Fitting the Existing Observations
Here are the important observations we have made so far:
- VAT does not directly cause illness, but is correlated with IHTG, which promotes metabolic dysfunction
- VAT can accumulate regardless of overall obesity level
- SAT expansion ability is partially based on genetics, but it’s more of a sensitivity than a hard stop
And here are the remaining important questions to answer:
- Why, from a functional standpoint, does the human body accumulate VAT in the first place?
- How do we reduce VAT accumulation?
- What explains the correlation between VAT and IHTG?
The main problem with the existing hypotheses about VAT accumulation is that they’re based around the long-standing assumption that disease occurs from eating too much. Essentially, they state that we have some SAT capacity, and eating too much exceeds that capacity, then the fat goes to bad places for some unspecified reason. According to conventional ideology, we must maintain a monk-like dedication of ignoring our appetites, while using unreliable psychology tricks like filling our stomachs with fiber and eating with smaller plates.
A Hormonal Story
First let’s look at how obesity and related metabolic diseases develop in general. Once upon a time, Thaler, et al. observed something striking: nutrient-poor diets cause injury in a region of the brain called the arcuate nucleus (ARC) before any symptoms of obesity occur. The ARC is a region within the hypothalamus that regulates energy balance; it handles many of the metabolic processes that ebb and flow based on bodily energy status at any given time. It seemed that somehow, the injury of ARC neurons was causing them to weaken their satiety signaling, triggering the need to eat, even in the presence of an energy-rich diet.
To understand how this signaling fails, two hormones are worth knowing. Insulin is released by the pancreas when blood sugar rises after a meal. It tells cells throughout the body to take up glucose, signals the liver to stop producing more glucose, and signals fat tissue to store rather than release energy. In short, insulin is the body’s “energy is available” signal during feeding. Leptin, on the other hand, is released by fat cells in proportion to fat mass, telling the brain about the body’s longer-term energy reserves.
Subsequent work showed how this might happen; not because unhealthy diets taste too good, or because calories are evil, but because endoplasmic reticulum (ER) stress in ARC neurons is causing the satiety signal from leptin to be blunted. Normally, fat cells send leptin to the brain, and more fat cells means more leptin, which means more satiety. That means in a healthy person, gaining fat should reduce their appetite on average, while losing fat increases appetite, allowing weight to stay in reasonable range. But when leptin signaling is blunted, satiety is not properly communicated, and appetite stays high even at increased fat mass. In other words, energy intake in the absence of proper nutrient protection is causing ER stress, which then decouples actual and perceived energy status, causing inappropriate low-energy adaptations (like increased appetite and resistance to insulin signaling) despite high energy intake.
Poor diet leads to cellular injury in the brain, interfering with hormonal signaling, and ultimately decoupling actual and perceived energy status.
VAT as a Stress Response
This study on anorexic women also challenges the SAT overflow model strongly. While regaining weight, the studied women accumulated a disproportional amount of VAT when compared with a control group of healthy women. Then, after a one year follow-up, their fat distribution normalized. That result highlights two importafnt details: first, VAT can accumulate even when levels of SAT are very low, contradicting the idea of VAT filling up only when SAT capacity runs out. Second, patterns of VAT accumulation can change in the same person, meaning that although genetics are relevant, they can be subsumed by metabolic state. In this case, being in a stressed starvation state increased the anorexic women’s VAT deposition until they became healthy.
How does this kind of metabolic stress lead to VAT accumulation? In 2001, Masuzaki et al. discovered that genetically overexpressing a single enzyme called 11β-HSD1 in fat tissue caused visceral obesity, fatty liver, insatiable hunger, insulin resistance, abnormal blood lipids, and high blood pressure, even on a normal diet! The enzyme works by regenerating active cortisol (the stress hormone) from its inactive form directly within fat tissue, raising local cortisol levels independent of how much the body is producing systemically. Vicennati et al. followed this up in a 2014 review, acknowledging the cross-talk between adipose tissue and the hypothalamic-pituitary-adrenal (HPA) axis, the body’s primary neuroendocrine stress response system. So there are two interacting routes to cortisol excess in fat tissue: the HPA axis raises circulating cortisol and its precursors, while local 11β-HSD1 amplifies cortisol within the fat itself. The stressed fat tissue then signals back to the HPA axis, creating a self-reinforcing loop that drives metabolic disease symptoms, including VAT accumulation.
All of this stuff sounds bad, and it was bad for the genetically modified animals studied. But what if the entire reason VAT accumulation, insulin resistance, blood pressure elevation, etc. exist is not because of some evolutionary accident, but because they are allostatic adaptations to severe stress or starvation? That’s what Gerald Shulman, a Yale endocrinologist who has spent his career studying the molecular basis of insulin resistance, seems to think. He frames insulin resistance as an evolved response to starvation that now misfires under what he calls a “toxic food environment.” Shulman addresses insulin resistance specifically, but I’m thoroughly convinced that the same logic extends to other metabolic adaptations: VAT accumulation, elevated blood pressure, etc., since they all share the same upstream trigger of perceived energy stress.
Now the increased VAT showing up in the anorexic women makes perfect sense, because that and other bodily adaptations could have meant the difference between life and death in their anorexic state. The manifestations wouldn’t be obvious because measurements like VAT, blood sugar, and blood pressure would be low in absolute terms. In relative terms, however, a stress response would allow these critical biomarkers to be elevated enough from levels that would otherwise cause death.
Remember from before that unhealthy diets cause ER stress in ARC neurons. Also clear from this 1997 paper is that proper leptin signaling suppresses the HPA axis, which makes sense because leptin signaling indicates energy sufficiency, and should therefore reduce stress responses that indicate an immediate energy need. So we can now construct a temporal sequence that makes a lot more sense for getting rid of VAT.
The Conventional View
- Lose enough weight until VAT disappears
- If you can’t lose weight, try harder to ignore hunger and use tricks like filling up on fiber
- If VAT persists even after weight loss, you have bad genetics
The Hormonal View
- Nutrient-poor diets lead to ER stress in ARC neurons, causing resistance to leptin signaling
- HPA axis is chronically activated, creating a persistent stress signal
- The stress signal triggers metabolic adaptations to energy scarcity, including increased hunger, VAT accumulation, and much more
Metabolic side effects result from a stress response due to perceived starvation, not from adipose tissue overflow.
Part 5: VAT’s Function and How to Reduce It
Biological Justification
We have learned of VAT’s accumulation under stressful conditions. But why does VAT accumulate in the first place? Why wouldn’t the body just accumulate more SAT instead? The SAT capacity exhaustion theories don’t effectively answer that question because they still don’t explain why evolutionary selection would prefer having a second type of fat instead of simply more of the same type. Instead, VAT has some unique properties that cement it as a proper emergency energy source:
- VAT has higher lipolytic responsiveness and mobilizes faster than SAT
- VAT drains directly to the liver via the portal vein, providing fatty acids and glycerol to help the liver create extra glucose during fasting
Perfectly reasonable for emergency energy when stressed, like in the recovering anorexic women regaining weight. But in pathological obesity, fat tissue continues releasing stored fat even during feeding, when insulin should be telling it to stop. The liver ends up with energy coming from three sources at once: the meal itself, the fat tissue that won’t shut off, and the liver’s own conversion of excess carbohydrates into fat. That’s why VAT correlates with IHTG; this abundance of energy, with VAT as a contributor, can accumulate as fat inside liver cells. Of course, the correlation doesn’t hold 100% of the time as the Fabbrini paper shows; the paper points out that only 20% of fatty acids transported to the liver via portal circulation come from VAT. What seems to be important is not VAT on its own, but whether the total amount of fatty acids to the liver from all three sources causes it to exceed capacity.
Once those fats start accumulating in liver, they start interfering with insulin signaling, and the liver’s glucose production never really shuts down. Normally during feeding, insulin helps the liver stop producing glucose because it signals that energy is already coming from food. Instead, when liver cells are resistant to insulin, they make extra glucose all the time because they never know whether food is present or not. Insulin resistance for liver cells in this case makes biological sense, because they have so much energy already that they want to avoid accumulating even more, lest they become damaged. The cells are effectively protecting themselves while causing undesirable side effects for the rest of the body.
VAT is useful as an emergency energy source during stress, but when the brain is chronically stressed by poor nutrition, the same delivery system contributes to liver fat accumulation and the protective insulin resistance that follows.
The Solution
The traditional solution offered for VAT reduction is to lose weight. That’s not very helpful. Luckily, the information presented here about how and why VAT develops offers a much more compelling idea: proper nutrition should prevent the brain from going into stress mode, and then VAT should not accumulate in significant amounts. We know that VAT accumulation involves genetics, but now with more information, we can see it’s not simply a matter of genetics dictating the storage of fat in X place or Y place. Instead, it’s how metabolic side effects present themselves in each unique individual when the brain perceives metabolic stress. Person A might need to be twice as stressed as person B to develop the same amount of VAT, but maybe person A develops high blood pressure more easily. These individual differences tempt us to play whack-a-mole with different metabolic diseases instead of addressing the real upstream cause.
Nutritional Ideas
Earlier we discussed ER stress in ARC neurons, but not what causes this ER stress in the first place. That’s where nutritional content matters. The problem is it’s easy to do a lab experiment with a “high-fat” or “high-sugar” diet and say that X fat or Y sugar are horrible, but that’s not always the case in an actual nutritious diet. Saturated fats, for example, are documented in some studies to cause serious problems. On the other hand, in real life, many people consume nutritious diets with lots of saturated fats and remain very healthy, which is why that literature is contested. In other words, context matters a lot because the interplay of nutrients can completely change the picture from lab experiments where only simple molecules are studied. Even foods that are widely regarded as healthy can look bad when intake of specific nutrients is insufficient.
As for how nutrition affects ER stress directly, multiple converging sources can act independently or synergistically:
1. Oxidative damage
Cells inevitably produce reactive oxygen species (ROS) during energy metabolism, and they rely on antioxidant systems to keep these in balance. When the balance tips toward excess ROS, damage accumulates in the proteins folding inside the ER and disrupts its redox environment, activating the unfolded protein response. Diets low in antioxidant nutrients (cysteine, selenium, zinc, B vitamins) or high in already-oxidized fats from refined oils (especially in junk food) tip this balance unfavorably.
2. Inflammatory signaling
Chronic low-grade inflammation, driven by gut barrier disruption and immune signaling from dysfunctional fat tissue, produces cytokines and inflammatory molecules that activate stress pathways inside cells. These pathways cross-talk with the ER stress response, amplifying it. The hypothalamus is particularly exposed to these signals because of its location near the median eminence, where the blood-brain barrier is more permeable.
3. Calcium dysregulation
The ER is the cell’s main calcium storage compartment, and proper calcium levels are essential for ER function, including protein folding and membrane integrity. When calcium handling fails (magnesium deficiency or other disruptions), the ER stress response activates independently of any direct lipid or protein problem.
On top of that, there are other nutritional nuances, like insufficient choline causing vulnerability to dietary fat-induced ER stress. The point is that a diet rich in key nutrients will protect against metabolic dysfunction, which will subsequently prevent a neural stress adaptation and all of the complications that come with it, including VAT accumulation. The oxidation angle on its own provides a great nutrient template:
- Protein (amino acids cysteine, glutamate, and glycine are necessary for glutathione synthesis)
- Selenium (for glutathione peroxidase enzymes)
- Zinc, copper, and manganese (for superoxide dismutase)
- B vitamins (helps support glutathione levels and glutathione recycling)
- Vitamins C and E (required amounts depend on dietary pattern, but useful for protecting against lipid peroxidation)
The same whole-food dietary pattern that supports antioxidant defense also tends to support the other arms (magnesium for calcium handling, avoiding wacky synthetic ingredients to preserve the gut barrier, choline for membrane integrity).
This is not an exhaustive list for complete nutrition, but a good starting point for key nutrients to focus on. A dietary pattern can fail even when it includes all “healthy” foods because the redox balance can be way off. Consider, for example, a rice bowl with some fish and vegetables. That can be radically different depending on the concentration of each ingredient. In a country like Japan, the ingredients would be well-balanced, while the same in the US is more likely to mostly be a giant pile of rice and comparatively lacking in the other ingredients. The former can be very healthy, while the latter can create an unfavorable redox balance when eaten repeatedly.
Nutrient-rich whole foods support the cellular defenses that protect against the ER stress driving metabolic dysfunction.
Part 6: Conclusion
The Big Picture
Too often, symptoms of metabolic disease are thought of as a matter of genetics. While true that individual manifestations of these symptoms vary, addressing root cause is much more effective because you can substantially reduce the risk that any of these symptoms will exist in the first place. Beer bellies are one such symptom; having one is a red flag, but not having one doesn’t guarantee good health. By understanding the pipeline of poor nutrition leading to ER stress and maladaptive adaptations in the brain, we now understand how and why beer bellies develop, which is a lot more powerful than following uninspired “lose weight” advice and hoping for the best.
Sources
Sniderman AD, Bhopal R, Prabhakaran D, Sarrafzadegan N, Tchernof A. Why might South Asians be so susceptible to central obesity and its atherogenic consequences? The adipose tissue overflow hypothesis. International Journal of Epidemiology. 2007;36(1):220-225.
Taylor R, Holman RR. Normal weight individuals who develop type 2 diabetes: the personal fat threshold. Clinical Science. 2015;128(7):405-410.
Lotta LA, Gulati P, Day FR, et al. Integrative genomic analysis implicates limited peripheral adipose storage capacity in the pathogenesis of human insulin resistance. Nature Genetics. 2017;49(1):17-26.
Fabbrini E, Magkos F, Mohammed BS, et al. Intrahepatic fat, not visceral fat, is linked with metabolic complications of obesity. Proceedings of the National Academy of Sciences. 2009;106(36):15430-15435.
Jakobsen MU, Berentzen T, Sørensen TIA, Overvad K. Abdominal obesity and fatty liver. Epidemiologic Reviews. 2007;29:77-87. doi:10.1093/epirev/mxm002
Thaler JP, Yi CX, Schur EA, et al. Obesity is associated with hypothalamic injury in rodents and humans. The Journal of Clinical Investigation. 2012;122(1):153-162.
Schneeberger M, Dietrich MO, Sebastián D, et al. Mitofusin 2 in POMC neurons connects ER stress with leptin resistance and energy imbalance. Cell. 2013;155(1):172-187.
Mayer LES, Klein DA, Black E, Attia E, Shen W, Mao X, Shungu DC, Punyanita M, Gallagher D, Wang J, Heymsfield SB, Hirsch J, Ginsberg HN, Walsh BT. Adipose tissue distribution after weight restoration and weight maintenance in women with anorexia nervosa. American Journal of Clinical Nutrition. 2009;90(5):1132-1137. doi:10.3945/ajcn.2009.27820
Masuzaki H, Paterson J, Shinyama H, et al. A transgenic model of visceral obesity and the metabolic syndrome. Science. 2001;294(5549):2166-2170.
Vicennati V, Garelli S, Rinaldi E, Di Dalmazi G, Pagotto U, Pasquali R. Cross-talk between adipose tissue and the HPA axis in obesity and overt hypercortisolemic states. Hormone Molecular Biology and Clinical Investigation. 2014;17(2):63-77. doi:10.1515/hmbci-2013-0068
Shulman GI (interviewed by Crawford S). How to reverse insulin resistance. Yale School of Medicine News. April 10, 2024. Available at: https://medicine.yale.edu/news-article/how-to-reverse-insulin-resistance/
Heiman ML, Ahima RS, Craft LS, Schoner B, Stephens TW, Flier JS. Leptin inhibition of the hypothalamic-pituitary-adrenal axis in response to stress. Endocrinology. 1997;138(9):3859-3863. doi:10.1210/endo.138.9.5366
Cao SS, Kaufman RJ. Endoplasmic reticulum stress and oxidative stress in cell fate decision and human disease. Antioxidants & Redox Signaling. 2014;21(3):396-413.
Lu SC. Glutathione synthesis. Biochimica et Biophysica Acta. 2013;1830(5):3143-3153.
Rayman MP. Selenium and human health. The Lancet. 2012;379(9822):1256-1268.
Prasad AS. Zinc in human health: effect of zinc on immune cells. Molecular Medicine. 2008;14(5-6):353-357. doi:10.2119/2008-00033.Prasad